
WarBrief Live | November 15, 2026 | Markets & Economy
| 20.9m b/d oil through the Strait of Hormuz, first half of 2025 (EIA) | ~20% of world petroleum liquids pass through Hormuz | 400m barrels IEA emergency release, March 11, 2026 — the largest ever | 6–10% Hormuz war-risk premium, early October 2026 (was 0.15–0.25%) |
War pushes oil prices up before a single barrel is lost, because traders price the chance of disruption. How far prices rise depends on how much supply is truly at risk.
That sentence explains most of what follows in this explainer on how war affects oil prices. The oil market does not wait for a pipeline to be bombed or a strait to close. It moves the moment traders believe either event has become more likely — and it moves again, often sharply in the other direction, when the feared disruption fails to happen. The war that began on February 28, 2026, when the United States and Israel launched strikes on Iran, has given the world a live demonstration: Brent crude rose from about $71 a barrel to nearly $122 within a month, then spent the rest of the year swinging with every headline from the Gulf. On November 14, Iran’s navy reported that three oil tankers had caught fire after striking mines in and around the Strait of Hormuz — a claim US Central Command dismissed as false and Reuters said it could not independently verify, as WarBrief reported the same day. Prices moved on the claim anyway. WarBrief tracks the wider Gulf war on its conflict-zones hub. This article explains why.
Key Takeaways
- Oil prices move on probability, not just on lost barrels: the war risk premium reprices the chance of disruption the moment tensions rise.
- Futures markets mean today’s price reflects what traders expect next month, so headlines can move oil before any physical supply changes.
- Chokepoints are the multiplier: about 20% of world petroleum liquids passed through the Strait of Hormuz before the 2026 war, with few practical bypasses.
- Shipping and war-risk insurance add a real cost per barrel — Hormuz cover rose from 0.15–0.25% of hull value before the war to 6–10% by early October 2026, according to brokers quoted by the Financial Times.
- Spikes fade when supply proves intact, strategic reserves are released, or producers add barrels — the IEA’s 400-million-barrel release of March 11, 2026, was the largest coordinated release in its history.
What is the war risk premium — and why does it move first?
The war risk premium is the extra price the market attaches to a barrel of oil when conflict makes future supply less certain. It is not a fee anyone pays at a till. It is the gap between the price oil would fetch in a calm world and the price it fetches once traders start worrying. Nothing physical needs to change for the premium to appear: no well has to stop pumping, no tanker has to turn back. The premium exists because buyers who need oil next month would rather pay more today than risk having none at any price tomorrow, and sellers who hold oil would rather wait than sell into a rising market.
Academic research supports the mechanism. The Geopolitical Risk Index developed by economists Dario Caldara and Matteo Iacoviello finds that spikes in geopolitical risk are consistently associated with higher oil-price volatility and short-term price increases. The intuition is simple. Oil is a physical commodity with almost no short-term substitute: a refinery cannot switch feedstock overnight, and an airline cannot fly without jet fuel. When the probability of a supply interruption rises — even from 5% to 15% — the price must rise enough to ration the barrels that might disappear and to reward whoever holds them through the uncertainty.
That is why the first market reaction to war is so often the largest. The invasion of Kuwait in August 1990 pushed Brent from roughly $17 a barrel in July to more than $36 by October, according to US Energy Information Administration (EIA) historical prices cited by Finorum. The 2026 Hormuz crisis followed the same script: Brent climbed from about $71 before the February 28 strikes to a high of $121.88 within 30 days, a rise of nearly 71%, on the EIA price series. In both cases, the market was pricing the worst plausible outcome — a wider war, a closed strait, a regional supply cut — long before any of it fully materialised.
How do futures markets price a war before it happens?
Almost all internationally traded crude is bought and sold through futures contracts: agreements to deliver a set amount of oil at a set price on a future date. That structure is the reason war moves oil prices before it moves oil. Today’s price is, in effect, a forecast. When a headline raises the chance that supply will be disrupted next month, traders bid up the contracts for delivery next month — and the spot price, the price for oil delivered now, follows, because nobody will sell cheaply today what they expect to sell dearly tomorrow.
This forward-looking structure also explains the pattern traders call “buy the rumour, sell the fact”. The 2003 invasion of Iraq produced a far more muted price reaction than the 1990 Gulf War, precisely because the buildup was telegraphed for months: the market had already priced in the war before the first shot, and Brent was roughly unchanged in the weeks after the invasion began. The same logic worked in reverse in November 2026. WarBrief reported on November 11 that Brent had fallen below $90 even as tankers burned in the Strait of Hormuz — because traders judged that the physical disruption, however dramatic on television, remained limited relative to the barrels still flowing, and that offsetting supply was available.
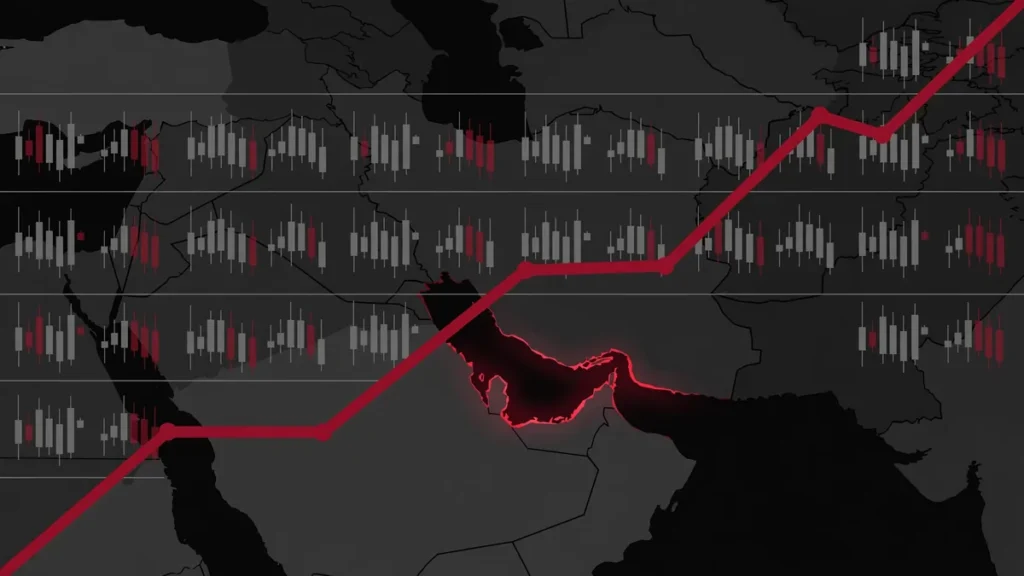
Futures also explain why oil can fall on bad news. If a war destroys demand — by tipping economies into recession, grounding aircraft, or closing factories — traders will price that in too. The sharpest price falls in wartime usually come when the market decides the conflict will shrink consumption faster than it shrinks supply. Fear moves prices up; fear of recession moves them down. Both are the same mechanism: the market repricing a probability.
Why does the Strait of Hormuz matter so much for oil prices?
Chokepoints are where the risk premium becomes a physical threat. The Strait of Hormuz, the narrow passage between Iran and Oman linking the Persian Gulf to the open ocean, is the world’s most important oil transit chokepoint, in the EIA’s words. The EIA puts total oil flows through the strait at 20.9 million barrels a day in the first half of 2025 — about 20% of global petroleum liquids consumption and roughly a quarter of all oil traded by sea. About 89% of the crude and condensate that crossed the strait went to Asian markets, with China, India, Japan and South Korea the largest buyers.
The strait is only 29 nautical miles wide at its narrowest point, according to the International Energy Agency (IEA), with shipping channels about two miles wide in each direction. There are pipelines that bypass it — Saudi Arabia and the United Arab Emirates both operate export routes to the Red Sea and the Gulf of Oman — but they can carry only a fraction of normal Hormuz volumes, and not every producer can reach them. That asymmetry is what gives a threat to the strait its leverage: closing it, or even credibly threatening to, puts a fifth of the world’s oil in doubt at a single point on the map.
The 2026 war has shown both the leverage and its limits. EIA estimates put Hormuz crude and liquids flows at 4.9 million barrels a day in the second quarter of 2026, down from 21.6 million in the last quarter of 2025 — a collapse driven by the effective closure of the strait to normal commercial traffic after February 28. IEA tanker-tracking data put flows at 10.9 million barrels a day in September 2026, up 3.7 million on the month, indicating a partial recovery through escorted and state-linked shipping even as attacks continued. The two agencies measure slightly different things, but the direction is the same: flows roughly halved, then began to climb back — and prices tracked that arc.
| Metric | Figure | Source |
|---|---|---|
| Hormuz oil flows, first half of 2025 | 20.9 million b/d, about 20% of global petroleum liquids | EIA — CONFIRMED |
| Hormuz oil flows, September 2026 | 10.9 million b/d | IEA, Oil Market Report, October 2026 — CONFIRMED |
| Brent before the February 28, 2026 strikes | About $71 per barrel | EIA price series — CONFIRMED |
| Brent 30-day high after February 28, 2026 | $121.88 per barrel (+70.9%) | EIA price series — CONFIRMED |
| IEA emergency release, March 11, 2026 | 400 million barrels, the largest ever | IEA — CONFIRMED |
| IEA release delivered by early October 2026 | About 325 million barrels (over 80%) | IEA via Anadolu Agency — CONFIRMED |
| Hormuz war-risk premium, early October 2026 | 6–10% of hull value per voyage (was 0.15–0.25%) | Brokers via the Financial Times — REPORTED |
| Tankers reported hit by mines, November 14, 2026 | Three tankers; CENTCOM calls the claims false | Iranian navy claims vs CENTCOM, via Reuters — REPORTED, UNVERIFIED |
Figures from different agencies and dates are not directly comparable. CONFIRMED items rest on two or more sources; REPORTED items rest on a single or interested source and remain unverified.
What happens when physical supply is actually lost?
The risk premium is the market’s first reaction. The second, slower reaction is to barrels that genuinely disappear. Physical supply can be lost in four ways: production is damaged or shut in, exports are sanctioned, pipelines and terminals are hit, or shipping is stopped. Each removes barrels from the market for as long as the damage lasts, and each has a different half-life. A closed strait can reopen in days; a destroyed export terminal can take months to rebuild; a sanctions regime can last years.
History shows that the size of the price move tracks the size of the physical loss more than the size of the headlines. The 1973 Arab oil embargo quadrupled prices — from about $2.90 a barrel to $11.65 in less than a year — because producers deliberately cut exports to the United States and several European countries. The 1990 Gulf War removed Kuwaiti and Iraqi exports from the market and pushed Brent from about $17 to more than $36, but prices fell back below $20 within weeks of Operation Desert Storm, once the coalition secured supply. Russia’s invasion of Ukraine in February 2022 sent Brent from $94 to an intraday peak of $139.13 in early March, on sanctions and the fear of lost Russian supply — yet by the end of 2022 Brent had moderated into the $80s as Russian crude found new buyers in India and China at discounted prices.
| Shock | Brent move | What decided it |
|---|---|---|
| 1973 Arab embargo | About $2.90 to $11.65 | Deliberate export cuts; no quick replacement |
| 1990 Gulf War | About $17 to over $36 | Kuwaiti and Iraqi supply cut; coalition restored confidence fast |
| 2022 Russia invades Ukraine | $94 to $139.13 intraday peak | Sanctions and supply fear; discounted rerouting softened the blow |
| 2026 Hormuz crisis | About $71 to $121.88 in 30 days | Partial strait closure; IEA released 400 million barrels |
Sanctions deserve separate attention, because they remove barrels without a shot being fired. When the United States and its allies sanctioned Russian oil after 2022, and Iranian oil before it, millions of barrels a day were pushed out of the open market. The barrels did not vanish — much of the oil was rerouted to buyers willing to take it at a discount — but the rerouting itself cost time, shipping and insurance, and the discount reshaped who profited. Sanctions are a slow supply shock, and their price effect depends less on the announcement than on enforcement: how many barrels actually stop moving, and for how long.
How do shipping and war-risk insurance add to the price?
Even when the oil keeps flowing, war makes moving it more expensive — and that cost lands in the delivered price. The most visible channel in 2026 has been war-risk insurance. Standard hull insurance excludes war risks, so a ship entering a listed war-risk area must buy separate cover for each voyage. Before the war that began on February 28, 2026, Hormuz war-risk cover typically cost 0.15% to 0.25% of a ship’s hull value, according to Lloyd’s List. By early October 2026, brokers quoted 6% to 10% for tankers, according to the Financial Times. On a $100 million tanker, that turns a premium of roughly $250,000 into $6 million to $10 million for a single transit. WarBrief’s companion explainer, War Risk Insurance Explained: The Hormuz Surcharge, works through the arithmetic in full.
Freight rates tell the same story from the other side. With fewer owners willing to send ships into the Gulf, the vessels that do sail command far higher rates — Gulf-to-Asia very large crude carrier rates hit a record near $1.4 million a day, according to Kpler data cited by trade monitors. Rerouting adds more: ships that avoid the strait sail thousands of extra miles around Africa or through longer routes, burning more fuel and taking weeks longer. The result is visible in the shipping bill before it is visible at the pump. WarBrief’s November 12 analysis of what the tanker war costs found the same pattern: insurance, freight and rerouting together form a war surcharge on every barrel that still moves, even when the crude itself is unchanged.
There is also a threshold effect. Insurance is not just expensive; it can become unavailable. When underwriters withdraw cover or reprice it daily, some owners simply refuse the voyage at any price, and the cargoes that do move shift to state-linked fleets willing to sail uninsured or self-insured. Trade press reported that transits through the strait ran about 70% below pre-war levels in the week ending October 14, 2026, according to gCaptain data — a reminder that the price mechanism and the physical mechanism are the same story told twice: fewer ships, higher costs, higher prices.
What pulls prices back down: strategic reserves, OPEC+ and demand
Three forces push against every war-driven price rise: emergency stocks, producer decisions, and demand. The fastest is the strategic petroleum reserve. On March 11, 2026, less than two weeks after the war began, the IEA’s 32 member countries unanimously agreed to make 400 million barrels available from emergency reserves — the largest coordinated release in the agency’s history, in its own words. About 325 million barrels had reached the market by early October, according to the IEA, with the United States contributing the largest single share, 172.2 million barrels. The release did not end the crisis, and crude rose more than 17% in the three days after it was announced — but it put a ceiling on how far the physical shortage could run, and it signalled that consuming governments would act together.
Reserves are finite, and that limit matters. EIA data released on November 12, 2026, put the US Strategic Petroleum Reserve at 279.5 million barrels in the week ending November 6 — its lowest level since 1982. Every barrel released is a barrel that must one day be bought back, and the IEA itself has said it is prepared to coordinate further releases only if member governments decide conditions warrant it. A reserve release buys time; it does not create oil.
The second force is OPEC+. The producer group’s decisions set the background supply against which any war shock lands. Its eight members fully unwound a 2.2-million-barrel-a-day layer of voluntary cuts between April and September 2025, according to Reuters, and resumed unwinding a further 1.65-million-barrel-a-day layer in 2026, with an adjustment of 206,000 barrels a day in April, OPEC said. On November 1, 2026, the group decided to hold December output unchanged. The lesson for readers is that a war shock landing on a market where producers are already adding barrels behaves very differently from one landing on a tight market where spare capacity is thin — and only Saudi Arabia and the UAE hold meaningful spare capacity to deploy quickly.
The third force is demand. High prices are their own cure: they discourage driving, flying and manufacturing, and they accelerate switching to other fuels. If a war also damages the wider economy, demand can fall faster than supply, and prices drop despite the fighting. That is the least intuitive part of the mechanism, and the reason generals do not set oil prices.
Why do oil price spikes fade — and when do they not?
Most war-driven oil spikes fade, and they fade for the same reason they appear: the market reprices a probability, and probabilities fall as facts arrive. The 1990 spike faded when the coalition showed it could protect Saudi infrastructure and restore Kuwaiti output. The 2022 spike faded when Russian barrels found new buyers and demand softened. In 2026, each round of good news — an escorted convoy, a release of reserves, a diplomatic opening — has trimmed the premium, while each attack or mine claim has rebuilt it. The price at any moment is a running vote on which outcome traders expect.
Spikes do not fade when the physical loss is permanent or the disruption becomes structural. The 1973 embargo reshaped the energy market for a decade because it was a deliberate, sustained cut by producers who controlled the taps — and it created the IEA and the US Strategic Petroleum Reserve in response. A full, sustained closure of Hormuz would be the modern equivalent: with about a fifth of world oil flows at stake and no bypass for most of it, the price effect would be measured in months, not days. Short of that, the pattern of 2026 is likely to repeat: sharp rises on escalation, partial retreats on reassurance, and a higher average price than before the war as long as the strait remains contested.
The comparison with the other great wartime haven is instructive. WarBrief’s explainer on why gold rises during war describes a similar mechanism — fear repriced into an asset — but gold has no chokepoint and no shipping bill. Oil is different because it must physically move, every day, through narrow waterways, in ships that need insurance, to refineries that cannot wait. That physical chain is what turns a distant war into a price at the pump.
What the oil-price mechanism means for US/UK/EU readers
For readers in the United States, Britain and the European Union, the mechanism reaches daily life through three channels: fuel, heating and inflation. Crude is the largest single input cost in petrol and diesel, so a sustained $20 rise in Brent typically feeds through to the pump within weeks, with the exact timing set by refining margins, taxes and currency moves. In Europe, where diesel dominates road transport and heating oil still warms many homes, the pass-through is faster and broader. In the United States, which imports only a small share of its oil through Hormuz — about 2% of petroleum consumption, according to the EIA — the effect is indirect but real: oil is priced globally, so a Gulf disruption raises the price of every barrel, wherever it is pumped.
The second channel is inflation. Central banks watch energy prices closely because fuel feeds into the cost of almost everything transported, manufactured or grown. A war-driven oil spike can force a choice no central banker wants: raise rates to fight inflation while the economy is already slowing, or hold rates and let prices run. The third channel is travel and trade. Airspace closures, higher jet fuel costs and dearer shipping raise ticket prices and the cost of imported goods — the same shipping surcharge described above, passed down the supply chain.
What should readers watch? Not the daily price, which is noise, but four signals: Hormuz transit volumes, IEA reserve announcements, OPEC+ decisions, and war-risk insurance quotes. When transits recover and insurance falls, the premium is fading. When they move the other way, the next rise is already being priced in. This article is educational only and is not financial advice: it explains how the market works, not where prices will go next, and no reader should buy or sell oil, fuel or related securities on the basis of it.
Frequently asked questions
Does war always push oil prices up?
No. War usually pushes prices up at first, because traders price in the risk of lost supply — but if the fighting is telegraphed in advance, if supply proves intact, or if the war damages demand more than supply, prices can fall. The 2003 invasion of Iraq was heavily anticipated, so Brent was roughly unchanged in the weeks after it began, and oil fell sharply in 2020 when the pandemic crushed demand.
Why did oil fall below $90 in November 2026 even as tankers burned in the Strait of Hormuz?
Because the market judged the physical disruption limited: flows were recovering, the IEA had released hundreds of millions of barrels from emergency reserves, and producers were holding output steady. Prices track expected supply, not the drama of individual incidents — when traders conclude the barrels will keep moving, the risk premium shrinks even while attacks continue.
How much oil passes through the Strait of Hormuz?
About 20.9 million barrels a day in the first half of 2025, according to the US Energy Information Administration — roughly 20% of global petroleum liquids consumption and about a quarter of seaborne oil trade. Flows fell sharply after the war began on February 28, 2026, and the IEA put them at 10.9 million barrels a day in September 2026.
What is the IEA emergency oil release?
On March 11, 2026, the International Energy Agency’s 32 member countries agreed to make 400 million barrels available from emergency reserves — the largest coordinated release in the agency’s history — to offset supply disruption from the war and the effective closure of the Strait of Hormuz. About 325 million barrels had been delivered by early October 2026.
Will petrol prices rise every time tensions rise in the Middle East?
Not necessarily. Crude is only one part of the pump price — refining margins, taxes, exchange rates and local competition matter too — and a short-lived tension spike may never reach the forecourt. Sustained disruption is what feeds through: if Brent stays elevated for weeks, fuel prices in the US, UK and EU usually follow within a similar timeframe.
Sources
- US Energy Information Administration: World Oil Transit Chokepoints — Strait of Hormuz
- International Energy Agency: Oil Market Report, October 2026
- Forbes Middle East: How Wars Move Oil Markets and What History Says About the Next Price Shock
- Finorum: Why Oil Prices Spike So Fast When War Breaks Out
- War Monitor: War & Oil Prices — Strait of Hormuz Risk Explained
- Anadolu Agency: Over 80% of emergency oil release already delivered, says International Energy Agency
- Reuters: Explainer — OPEC+ Policies of Oil Output Hikes and Cuts
- The Boston Report: Strait of Hormuz Insurance Rates — War-Risk Cover Hits 6–10%


Discussion 0
Share analysis, corrections, or context. Be civil — comments are moderated.