
WarBrief Live | November 12, 2026 | Shipping & Logistics
5
commercial transits on Saturday, November 7, 2026 — none on Sunday — against more than 130 a day before the war (Kpler via Reuters)
0.02% → 3–5%
war-risk premium range, from pre-war levels to current broker quotes (RSDI / Lockton)
$1.37m
VLCC daily earnings, Middle East–China, on October 16, 2026 — up from about $56,000 in January (UNCTAD)
$124
Brent average per barrel in October 2026, the highest monthly figure since July 2022 (EIA)
Two supertankers carrying more than four million barrels of oil caught fire in the Strait of Hormuz overnight on November 11–12, 2026, after striking naval mines. The bill for the tanker war now falls on insurers, shippers and fuel buyers.
Key Takeaways
- Two supertankers carrying more than four million barrels of oil were disabled by explosions in the Strait of Hormuz overnight on November 11–12, 2026, after striking naval mines on a route Iran calls unauthorised.
- Commercial traffic through the strait has collapsed: ship-tracking data cited by Reuters recorded five transits on Saturday and none on Sunday, against more than 130 a day before the war.
- War-risk insurance that cost about 0.02–0.05% of a vessel’s value before the conflict is now quoted at 0.3–1% per voyage by one research institute and at 3–5% by a major broker — a spread that shows how fast prices are moving.
- Freight has followed: UNCTAD records daily earnings for very large crude carriers on the Middle East–China route up from about $56,000 in January to $1.37 million on October 16, 2026, while rerouting around Africa adds 10–14 days to a voyage.
What happened in the Strait of Hormuz overnight?
Iran’s Islamic Revolutionary Guard Corps (IRGC) Navy said on November 12, 2026, that two supertankers exploded and were disabled in the Strait of Hormuz after attempting to transit what it calls an unauthorised southern shipping route. Iranian state television reported that the vessels had struck naval mines, and the IRGC said both were carrying a combined total of more than four million barrels of oil and were now burning. The IRGC said the tankers had ignored repeated warnings from its traffic control centre about the route, which it describes as unsafe and prohibited.
What is confirmed is that two large tankers were disabled by explosions overnight; what remains unverified is the precise cause, which rests so far on Iranian accounts alone. The IRGC described the event as an “accident” in its statement, while Iranian state television attributed the explosions to naval mines. The vessels’ names and flags have not been confirmed in the reporting available at publication, and no independent verification of the mine claim has been published.
“Last night, two tankers — acting in violation of regulations and despite repeated warnings from the Revolutionary Guards Navy regarding the unauthorised and dangerous nature of the southern maritime route — were involved in an accident while traversing this prohibited path in the strait.” — IRGC Navy statement, as reported by The Hindu
The overnight incident was not isolated. A day earlier, on November 11, 2026, the UK maritime security firm Ambrey reported that an unknown projectile struck a merchant vessel 14 nautical miles northwest of the UAE’s Ras Al-Khaimah as the ship was heading out of the strait, causing a fire in the engine room with no injuries reported. Iran’s regular navy also reported on November 11 that an oil tanker caught fire after striking a naval mine east of the strait. WarBrief reported on November 10 that an ADNOC vessel had been damaged and another tanker struck near the strait.
The tempo of attacks has risen sharply. Dawn reported on November 12, 2026, that at least 10 ships were hit in the first 10 days of November, after 37 attacks in October — the highest monthly tally since the conflict began on February 28, 2026. The International Maritime Organization has confirmed 133 incidents in the region, with at least 25 seafarers killed.
How much has war-risk insurance risen for Hormuz transits?
War-risk cover is an additional premium paid on top of standard hull insurance before a vessel enters a listed high-risk area, often for a seven-day period, with terms reviewed every 24 to 48 hours. Before the conflict, that additional premium for a Hormuz transit was about 0.02–0.05% of a vessel’s insured value, according to the Ras Al Khaimah-based research institute RSDI. Its analysis now puts the range at 0.3–1% per voyage, with extreme cases reaching several percentage points of hull value. For a tanker insured at $100 million, 0.3% is $300,000 and 1% is $1 million for a single transit.
Other estimates run higher. The broker Lockton reports that marine war-risk premiums for Hormuz transits have risen to around 3–5% of vessel value, against 0.2–0.5% before the conflict, with marine cargo war-risk premiums up 200–300% and extreme cases rising more than 1,000%. A specialist shipping intelligence site, Region Alert, puts current premiums at 2.5–4.0% of insured hull value per voyage. Industry analysis published by Glosema records quotes reaching roughly 3–10% at points in 2026 for the highest-risk vessels. These figures are not a single market price: they are ranges from different sources, at different dates, for different vessels, flags, cargoes and policy terms. The honest statement is that a Hormuz transit that cost tens of thousands of dollars to insure in February now costs hundreds of thousands to several million — and some voyages cannot be insured at all.
That last point matters most. RSDI notes that major insurers have issued cancellation notices for war-risk cover across the Arabian Gulf, and the UK P&I Club issued a 24-hour notice of cancellation for war-risk extensions covering Hormuz transits in its Circular 05/26 of March 2026. When cover is withdrawn, the choice is not between an expensive transit and a cheap one; it is between an uninsured transit and no transit. The International Maritime Organization says about 20,000 seafarers are stranded in the Arabian Gulf or the Gulf of Oman.
Why freight rates have risen fivefold on some routes
Insurance is only the first charge. A UNCTAD report published on October 29, 2026, “Strait of Hormuz Disruptions: Soaring fuel prices and the burden of inflation”, found that tanker shipping costs have risen sharply since the conflict began, driven by reduced tanker availability, longer routes and time-consuming ship-to-ship transfers. By October 19, the Baltic Exchange Dirty Tanker Index, which tracks crude oil transportation, had reached 371 against a baseline of 100 on February 27, 2026. The Clean Tanker Index, covering mainly refined products, reached 280 over the same period.
The earnings figures behind those indices are stark. UNCTAD cites Baltic Exchange data showing daily earnings for very large crude carriers on the Middle East–China route rising from about $56,000 on January 9, 2026, to $1.37 million on October 16 — a roughly 25-fold increase. These are route-specific earnings estimates, not average rates for the global fleet, but they show where the market has moved.
On the routes that feed Asian buyers directly, the consultancy Drewry told ThePrint that freight rates from Fujairah in the UAE to India’s west coast surged to $7.51 per barrel in October, against $1.57 per barrel in late February — a 377% increase — and nearly doubled in a single month from $4.76 in September. UNCTAD also reports that shipping fuel prices were 72% higher by October 20, 2026, than their average during the six months before the conflict. Fewer willing vessels, longer voyages and costlier fuel all point the same way.
Rerouting around the Cape of Good Hope: the 10–14 day detour
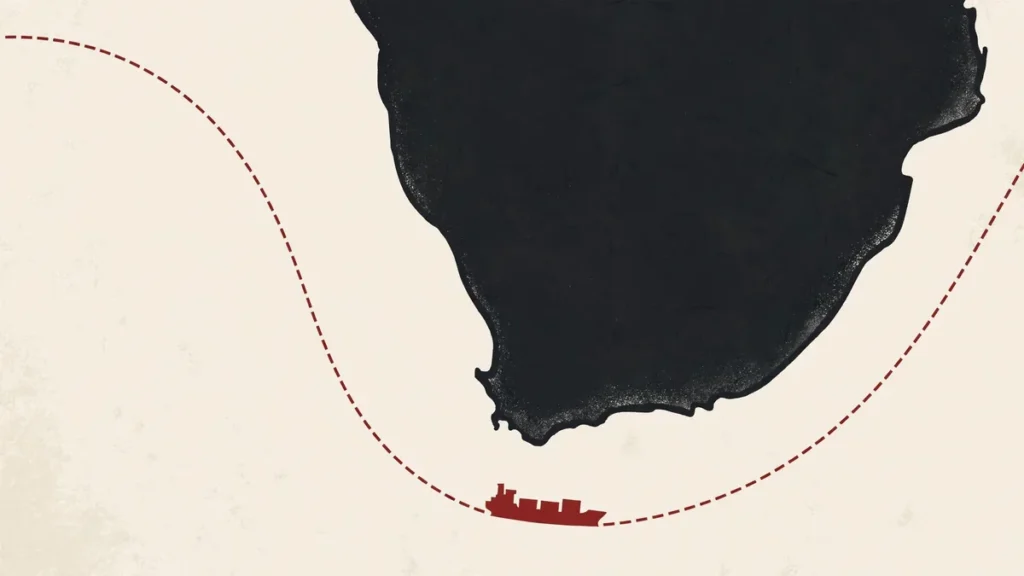
For cargoes that cannot risk the strait at any price, the alternative is the long way round. Drewry told ThePrint that vessels diverting around the Cape of Good Hope must cover an additional 3,500–4,000 nautical miles, adding 10–14 sailing days, raising fuel consumption and reducing effective vessel capacity. A growing share of US-to-Asia LPG shipments is already taking that route, tightening availability of very large gas carriers and pushing up freight costs there too.
Not all of the oil needs the strait. Saudi Arabia has pushed more crude across the peninsula on the 1,200-kilometre East-West Pipeline to the Red Sea port of Yanbu — about four million barrels a day, according to Saudi officials cited by Al Jazeera — and the pipeline’s restart helped Middle East exports tick up in October, according to ship-tracking data cited by the US Energy Information Administration. Ship-to-ship transfers off Oman’s coast have stitched together cargoes that would not risk a clean run through the strait. These workarounds keep barrels moving, but they add handling, time and cost at every step, and the pipeline itself was shut for several days in September after drone strikes on a pumping station that Riyadh said were launched from Iraq.
By the numbers: the cost of the tanker war
| Metric | Figure | Status | Source |
|---|---|---|---|
| Commercial transits, Saturday November 7, 2026 | 5 (none on Sunday) | Confirmed | Kpler data via Reuters |
| Commercial transits per day before the war | 130+ | Confirmed | Kpler data via Reuters |
| Attacks on shipping, October 2026 | 37 | Confirmed | Dawn |
| Ships hit, November 1–10, 2026 | 10 | Confirmed | Dawn |
| IMO-verified incidents since February 28, 2026 | 133 | Confirmed | International Maritime Organization via Dawn |
| Seafarers killed | 25+ | Confirmed | International Maritime Organization via Dawn |
| Seafarers stranded in the Gulf / Gulf of Oman | ~20,000 | Confirmed | International Maritime Organization via RSDI |
| Brent average, October 2026 | $124 per barrel | Confirmed | US Energy Information Administration |
| Middle East production shut-ins, October average | 2.5 million barrels per day | Confirmed | US Energy Information Administration |
| Baltic Dirty Tanker Index, October 19, 2026 | 371 (baseline 100, February 27) | Confirmed | UNCTAD / Baltic Exchange |
| VLCC daily earnings, Middle East–China, October 16 | $1.37 million | Confirmed | UNCTAD / Baltic Exchange |
| Freight, Fujairah to India’s west coast, October | $7.51 per barrel (from $1.57) | Confirmed | Drewry via ThePrint |
| War-risk premium, pre-war | 0.02–0.05% of hull value | Confirmed | RSDI |
| War-risk premium, now (research institute range) | 0.3–1% per voyage | Confirmed | RSDI |
| War-risk premium, now (broker range) | 3–5% of vessel value | Confirmed | Lockton |
| War-risk premium, now (highest reported) | Up to 10% | Reported | Glosema / industry estimates |
| Cape of Good Hope detour | +3,500–4,000 nautical miles, +10–14 days | Confirmed | Drewry via ThePrint |
Premium figures are ranges from different sources at different dates, not a single market price. Final premiums depend on the vessel, flag, cargo, destination and policy terms.
What the Hormuz shipping crisis means for US/UK/EU readers
The most direct effect is at the pump, and it is already visible in the price data. Brent crude averaged $124 a barrel in October 2026, $10 higher than September and the highest monthly average since July 2022, according to the US Energy Information Administration’s November Short-Term Energy Outlook. The same outlook records Brent falling below $100 a barrel on November 4, 2026, as Middle East exports rose and ship-to-ship transfers kept barrels moving, and it forecasts Brent averaging around $100 a barrel during November and December. Pump prices lag crude by weeks, so October’s peak is still working through to filling stations in the US, the UK and the EU — and any fresh attack can push the next month’s average back up.
The second effect is on the price of goods. Container carriers have begun imposing war-risk surcharges on Gulf-bound cargo: Hapag-Lloyd announced surcharges from $1,500 per standard container to $3,500 for reefer and special equipment shipments from early March 2026, according to Moneycontrol. Longer voyages around Africa mean slower deliveries and tighter vessel supply, which feeds into freight costs on routes far from the Gulf. For import-dependent economies, the scale is large: analysts estimate that every $10 per barrel rise in crude prices increases India’s annual oil import bill by about $13–14 billion, a figure that illustrates how quickly a shipping crisis becomes a household bill.
The third effect is on energy security planning. OPEC+ said in its monthly report, covered by Al Jazeera on November 11, 2026, that its oil output is approaching pre-war levels despite the attacks — Saudi Arabia pumped 10.563 million barrels a day in October. That recovery is real, but it rests on pipelines, transfers and convoys rather than on normal shipping. Until commercial traffic returns to something like its pre-war volume, the market is paying a war premium on every barrel that leaves the Gulf. This article is educational and is not financial advice.
Why the oil price fell even as tankers burned
Readers who followed WarBrief’s analysis of why oil fell below $90 even as tankers burned will recognise the paradox: the strait can be dangerous and the oil market can still soften, because the market prices the workaround, not the strait. Middle East production shut-ins averaged 2.5 million barrels a day in October, down from a peak of 10.9 million a day in May, according to the EIA. Saudi output rose, the East-West Pipeline restarted, and ship-to-ship transfers along Oman’s coast kept flows going. Brent slipped below $100 on November 4, 2026, even as attacks continued.
That does not mean the shipping crisis is priced in and finished. It means the market has learned to route around it — at a cost measured in premiums, freight and days, which is exactly the bill this article totals. The risk is that the workaround itself becomes the target: the September drone strikes on the East-West Pipeline showed that the bypass is not safe either. The wider war, which the US president has described as effectively over, continues to be fought in the shipping lanes even as diplomacy moves elsewhere. For the full picture of the conflict, see the WarBrief Conflict Zones hub.
What to watch next in the Strait of Hormuz
- Identification and salvage of the two supertankers: their names, flags, owners and cargoes will show whether the vessels were targeted or simply in the wrong corridor, and whether the oil is recovered or lost.
- Daily transit counts: Kpler data showed five transits on Saturday and none on Sunday. A recovery above that level would signal that convoys and the authorised northern corridor are working; another week near zero would confirm the strait is effectively closed to normal commerce.
- Insurance renewal windows: war-risk terms are reviewed every 24 to 48 hours. Any fresh cancellation notice from a major P&I club would push more owners toward the Cape route or out of the Gulf trade entirely.
- UKMTO and IMO updates: the next incident bulletins will show whether the November attack rate — 10 ships in 10 days — is accelerating or levelling off.
- OPEC+’s next output review: if Gulf producers cannot keep output near pre-war levels while the strait is disrupted, the oil price will carry the shipping premium back into the crude price itself.
Read next: on November 12 the Houthis claimed a drone strike on the East-West Pipeline and a missile strike on Yanbu — the bypass this article explains, now itself under attack.
Frequently asked questions
How much does war-risk insurance cost for a Hormuz transit now?
It depends on the vessel, flag, cargo and terms, and quoted ranges differ widely. RSDI puts current premiums at 0.3–1% of hull value per voyage, against 0.02–0.05% before the conflict, while the broker Lockton reports around 3–5% of vessel value. For a tanker insured at $100 million, that is roughly $300,000 to $5 million per transit.
How many ships still use the Strait of Hormuz?
Very few. Ship-tracking data from Kpler, cited by Reuters, recorded five commercial cargo transits on Saturday, November 7, 2026, and none on Sunday, against more than 130 ships a day before the war began on February 28, 2026. Some vessels transit with their AIS tracking switched off, so the true figure may be slightly higher.
Why are ships rerouting around the Cape of Good Hope?
Because the detour, though long, is predictable. Routing around Africa adds 3,500–4,000 nautical miles and 10–14 sailing days, according to Drewry, but it avoids war-risk premiums that can run to several percent of a vessel’s value per voyage and the risk of attack in the strait. Owners weigh the certain cost of the detour against the uncertain cost of a transit.
Will fuel prices rise because of the Hormuz shipping crisis?
They already have, in part. Brent crude averaged $124 a barrel in October 2026, the highest monthly average since July 2022, though it fell below $100 on November 4 as workarounds kept oil flowing. The EIA forecasts Brent averaging around $100 a barrel in November and December. Pump prices follow crude with a lag of weeks, so the effect on filling stations is gradual rather than immediate.
How many ships have been attacked in the Strait of Hormuz?
The International Maritime Organization has confirmed 133 incidents in the region since the conflict began, with at least 25 seafarers killed. Attacks reached their highest monthly level in October 2026, with 37 recorded, and at least 10 ships were hit in the first 10 days of November, according to Dawn.
Sources
- Al Jazeera: Iran war live — two supertankers hit naval mines in the Strait of Hormuz
- The Hindu: Iran’s Guards say ‘accident’ left two tankers on fire in Hormuz
- Dawn: Tanker attacks, oil spills persist in Strait of Hormuz
- US Energy Information Administration: Short-Term Energy Outlook, November 2026
- Safety4Sea: UNCTAD — Tanker freight rates and bunker costs surge amid Hormuz disruptions
- ThePrint: West Asia crisis hits India’s Gulf oil shipping edge, tanker freight costs up 5x
- RSDI: Insurability as Power — Reframing Control in the Strait of Hormuz
- Lockton: Marine, Aviation War Risk Premiums Rise As Insurers Reassess Exposure Amid Iran War
- Moneycontrol: Hormuz transit costs may rise up to 50% as war-risk premiums spike
- SeaNews: Severe Disruption of Maritime Traffic in the Strait of Hormuz Amid Attacks
- Glosema: Insurance Can Make an Open Shipping Route Uneconomic
- Region Alert: Hormuz Strait Intel — Traffic, Oil & Iran Harassment


Discussion 0
Share analysis, corrections, or context. Be civil — comments are moderated.